What is the Hidden Factory?
The Hidden Factory is a concept that refers to the unseen, or hidden, parts of a manufacturing process that result in quality issues or decrease the efficiency of the operation.
What’s causing this? It depends on the operation at hand, but typically it is due to the difficulty of measuring and accounting for costs associated with certain parts of a process.
For example, it may be easy to track the number of parts created, but it may be more difficult and less accurate to track cycle times. This could result in poor estimates, reduced production goals, and ultimately unseen waste.
How to Reveal (and Exploit) the Hidden Factory
Surfacing the Data
The hidden factory lies just beyond the existing way in which your business is measured. The problem is that in many cases the information reviewed to understand the performance of the shop floor is highly inaccurate. From inaccurate cycle times, poorly developed work standards, to flawed performance benchmarks based on incorrect assumptions.
Without accurate production data, managers simply cannot hope to find the hidden waste on the shop floor. While strict manual data collection methods can take job shops to a certain degree, the sophisticated manufacturer is leveraging solutions that collect, aggregate, and standardize production data autonomously. With this data in hand, accurate benchmarks can be set (they may be quite surprising) and areas of hidden capacity, as well as waste-generators, can be far more easily identified.
Calculate Rolled Throughput Yield
One excellent tool for identifying the hidden factory is Six Sigma’s Rolled Throughput Yield (RTY), which is a calculation that shows what your yield is for all products. Knowing this helps you zero in on the worst process performance to develop strategies for continuous improvement. The first step is to identify the Defects Per Unit. This calculation is a simple expression of DPU=D/U.
The formula then determines the yield by using a mathematical constant of e, equal to 2.718 and expressed as e=2.718-DPU.
Finally, the RTY is calculated as a percentage of multiplying all yields for all processes. For example, if you have the following yields of 0.90, 0.91, 0.99, 0.98, and 0.97, the yield would be 0.77, or 77%.
Waste Generators
Once you know your yield, you can focus on specific processes to identify the poorest performer. These can be classified within which category of the waste generation belongs to a group of like performers. Types of waste generators include:
- Waiting (Delays)
- Process Workarounds
- Non-Value-Added Work
- Plant Layout
- Inventory Errors
- Training
- Defective Products
- Over-Processing
- Quality Fallout
By mapping out RTY and classifying which waste generator it belongs to, teams can group them to address a specific waste category process rather than tackling each poor yield one at a time. Machine monitoring can be an effective solution for identifying the types of waste your operation is experiencing.
This is an excerpt from the “THE HIDDEN FACTORY: HOW TO EXPOSE WASTE AND CAPACITY ON THE SHOP FLOOR” article written by Bill Bither, the CEO of MachineMetrics. Read the full article here to find out the following:
Why is exposing the hidden factory important?
The true cost of the hidden factory
The benefits of discovering the hidden factory
Running a Capacity Analysis
Once accurate machine and production data is collected, hidden capacity can be found using a capacity analysis. For brevity, here is a quick summation.
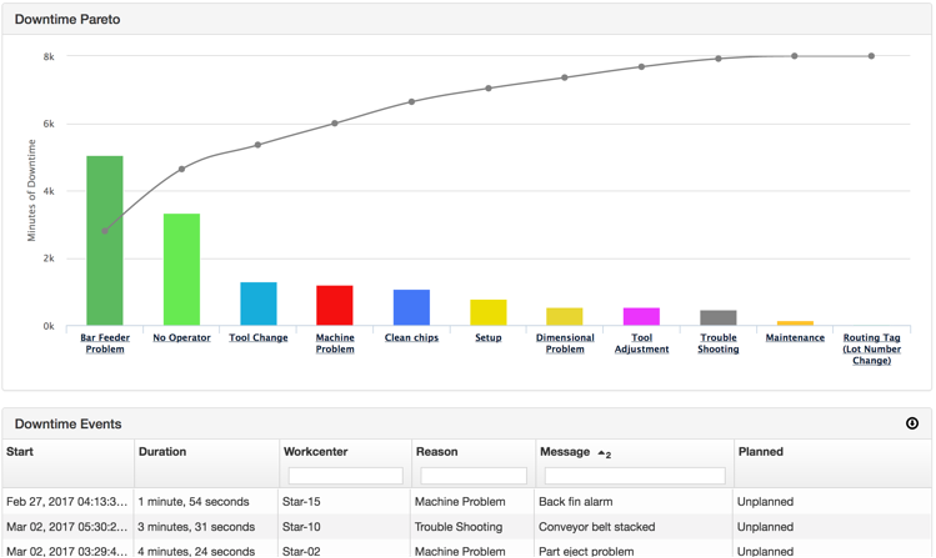
Benchmark Data: Benchmarking includes determining existing capacity. Machine speed, quality losses, downtime by categories – such as breakdowns, changeovers, and performance losses – must all be measured to determine the current capacity.
Analyze Downtime: Once a manufacturing operation has benchmarked its data and understands its true utilization, a downtime analysis must be conducted. By answering how much downtime is occurring and what category the downtime falls under, steps for improvement become more apparent.
Rollout Process Changes: Managers are now equipped with accurate and verifiable data that drives real change at this point in the capacity analysis. These changes can be used to tackle the most significant capacity constraints, unlock the hidden capacity to eliminate overtime, reduce the need for capital expenditure, and hone a maintenance program that works in sync with changeovers and other operating conditions instead of contention with them.
Managing Transaction Overhead
Businesses that have never utilized Lean or Six Sigma methodology or initiated process improvement based on designing an industrial IoT system are almost guaranteed to have a high transaction overhead.
Many poor processes are transaction-driven, meaning that recording, calculating, and rationalizing steps must be taken to move the process forward. Many of these may be redundant, while others are ideal for automation. Managing transaction overhead is crucial to identifying elements to unlock the hidden factory.
Hidden Factory Examples
The hidden factory concept contains numerous covert inefficiencies within various industries. Examples include the costly rework and scrap resulting from manufacturing defects, unplanned downtime caused by equipment failures, and the financial burden of maintaining excessive inventory. Employee overtime, communication breakdowns in project management, defects leading to product returns, and inefficient processes further contribute to this hidden factory. Energy waste and the challenges associated with mismanaging inventory and labor amplify these issues. Recognizing and addressing these concealed factors is paramount for organizations seeking to optimize operational efficiency, reduce costs, and enhance overall productivity, ultimately ensuring a more streamlined and effective business operation.
The Hidden Factory and Digital Transformation
The concept of unlocking the hidden factory is an exciting and challenging journey. It’s certainly one that will challenge your continuous improvement mindset as you continue to reduce waste and inefficiencies.
Unlocking the hidden factory should go side by side with digital transformation. Data gathered by connected equipment with edge devices and IoT sensors deliver incredible value by providing a source of real-time, accurate information with which to search for areas of concern.
The changes made along the way are immediately measurable in real-time when done in conjunction with digital transformation. Managers can spend more time on the front end of the project implementing process improvement because they can access the data faster and more accurately.