
The world is surrounded of problems to solve at the same time companies need to use innovation to offer new products and new services for their customers. There are several technologies already available to be combined by smart teams to support leadership on decision-making, managers to lead teams efficiently, and execution to run more with less. The biggest challenges are: the real understanding of the problem to be solved (or the new offer of a product or service), the scope of a POC and MVP, and mainly which tools to use to solve that problem. The budget and team-building are interlaced. For the topic of this article, a multidisciplinary team with strong knowledge-base and real-world previous experiences in their respective areas make a huge difference. The management way of leading and the technologies to be adopted are the necessary elements to complete the Digital Transformation puzzle: people + processes + technologies.
There is no doubt that having in hands real-time anomaly detection information can prevent big losses in financial resources, infrastructures, and people’s lives. Real-time anomaly detection is able (but not limited) to:
• Send real-time notification about forest fires and climate matters;
• Due to early stage capturing of abnormal behavior prior to an earthquake, send an immediate alert for evacuation in smart cities and smart buildings;
• Predictive maintenance in industry prior to a motor full-stop;
• And several other solutions that can be built with the appropriate adaptations to support quick and assertive decision-making.
In this article, it is going to be presented the application of Machine Learning [ML] and Deep Learning [DL], with the support of Internet of Things [IoT] (for data collection and the wireless transmission/reception of data and information between the Edge, Fog, and Cloud Computing layers), for a solution that runs the real-time anomaly detection at the Edge using EmbeddedAI.
But, first, the topic of Data Engineering is the basis because of data collection: few tens of minutes of data are needed to compose the datasets with Training data and Test data for the AI algorithms.
Considering the variety of techniques that Machine Learning [ML] can provide, some of them are explored in this article, such as Classification (Supervised Machine Learning) and Clustering / K-means (Unsupervised Machine Learning) for the anomaly detection. In additional, the topics of Time Series [TS] and Deep Learning [DL] / Artificial Neural Networks [ANN] are also related.
Data Engineering, Embedded Systems, Internet of Things [IoT]
The term EmbeddedAI (EdgeAI, EdgeML, TinyAI, or TinyML) is because the algorithms of ML and DL models will be executed locally at the Edge (Edge Computing) in an embedded electronic system (Embedded System), to run the inference of real-time data to result in “Normal” or “Anomaly” behavior classification.
For this article, the anomaly detection will be placed on an industrial motor, which from now on will be called “equipment”.
For the collection of “Normal” behavior data on the equipment (the category labels are: “class33” and “class22”), an accelerometer sensor (with 3 Degrees Of Freedom [3DOF]) is fixed on the equipment and it is connected to a Microcontroller [MCU] at the Edge (Embedded System). The simulation of the “Anomaly” behavior will occur when any other type of behavior or disturbance (physical or electrical) not foreseen in the training phase occurs.
When in Production, the concept of Sensor Fusion is applied, where more than one sensor is used to characterize with more elements the “Normal” or “Anomaly” behavior classification. In addition to some sensors that can be considered (vibration, audio signal, computer vision), it can also be considered sensors for temperature, humidity, pressure, luminosity, different types of gases, volatile organic compounds, among others.
Regarding the data collection itself, other factors are also important for choosing the Microcontroller [MCU] (Edge Computing layer) and the Single Board Computer [SBC] (Fog Computing layer), such as the choice of the sensors and other elements that will compose the environment of both layers, and how the datasets with the collected data will be created. Electrical working range of all devices must follow the same logic level adopted (5V or 3V3) (if not matching, an auxiliary circuit with a logic level converter must be built), enabled interfaces (I2C for displays, SPI for RF/radio, Serial channels for other communications), working temperature, etc.
The system architecture should assume a distributed systems approach for the best usage of computational resources, which directly impacts the amount of data collected per second, that’s why the number of cores in the CPU of the MCU is also important (in this case, a 32-bit dual-core), according to the image shown in Figure 1.
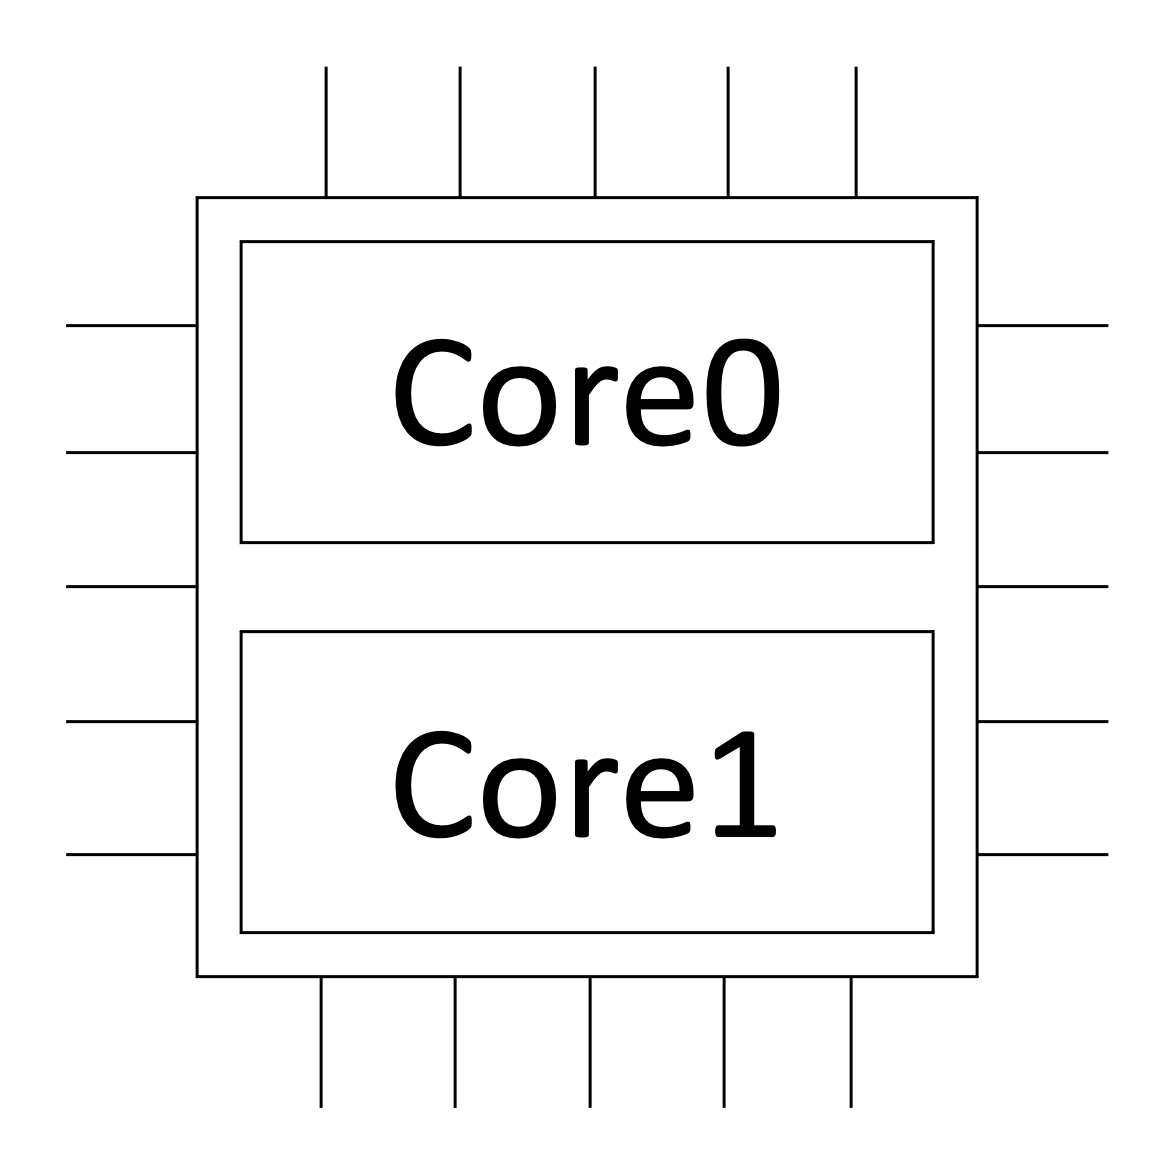
Source: Wardston Consulting
The choice of the Microcontroller [MCU] and the choice of a Single Board Computer [SBC] is fundamental for the success of the solution. The relation between the layers (Cloud, Fog, Edge) considered for the goal is according to the image shown in Figure 2.
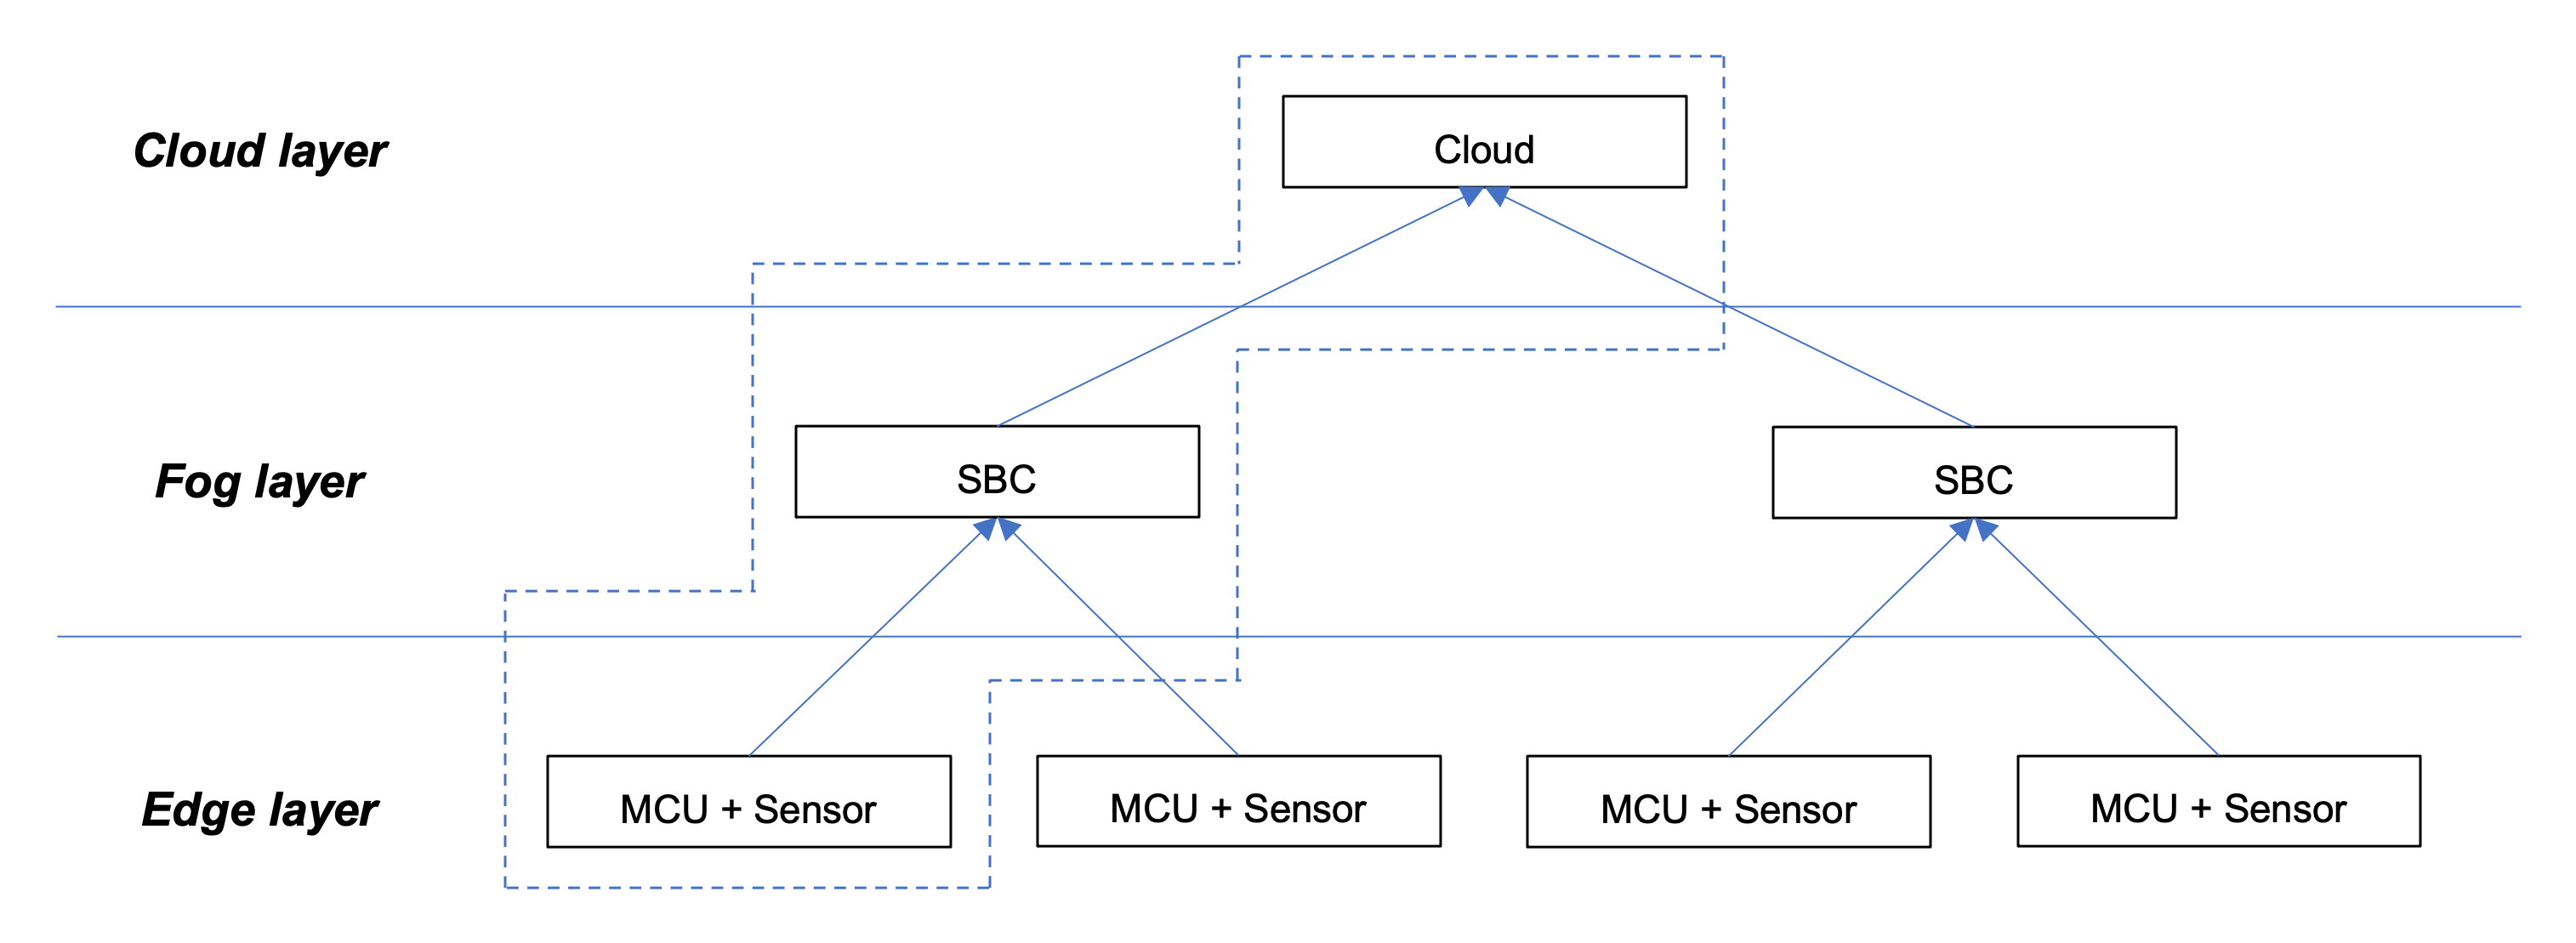
Source: Wardston Consulting
It is mandatory that the data collection environment and the data inference environment must be the same.
Data Input, Data Processing, AI Learning
It is important to point out that even though the Training and Testing steps will be carried out on the cloud env (Cloud Computing) (to assist in the development, training, and testing of AI algorithms), the inference of the data will be performed locally on the MCU (Edge Computing). Because of that, there is a different approach when compared with the traditional one when all steps are performed in the Cloud. Since the inference of the data is at the Edge, it is important to remember that the MCU has less processing power when compared to the Cloud, therefore, the Machine Learning [ML] hyperparameters and the Deep Learning [DL] / Artificial Neural Network [ANN] inputs and hidden layers with the neurons must be configured in order to find the optimal point to equalize the best quality in the results and the processing power of the chosen MCU.
The configuration of the project to meet the nature of the problem, took place through the use of:
• Data input: Time Series [TS] (a few dozen .csv files with the collected data that make up the Training and Test datasets);
• Data processing: Spectral Analysis (to reduce the dimensionality of the data);
• AI learning: Classification (Supervised Machine Learning) + Artificial Neural Network [ANN] Classifier (Deep Learning) + Anomaly Detection (Clustering / K-means) (Unsupervised Machine Learning).
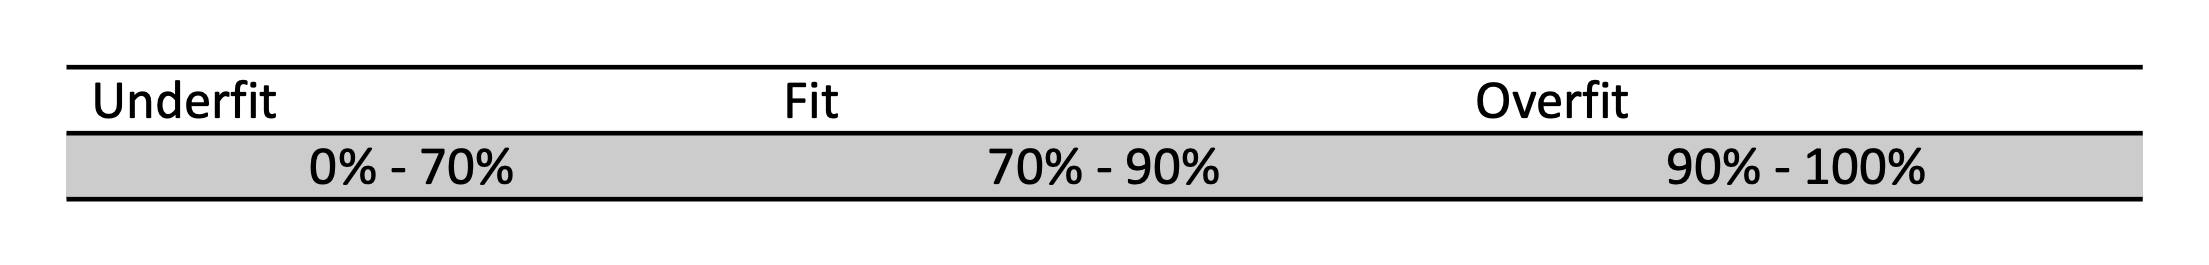
The data collection process will be repeated until obtaining the Accuracy between 70% – 90% in the Training data and in the Test data, where the “Fit” is characterized for a good inference of the data in Production. The “Underfit”, “Fit”, and “Overfit” ranges of the model are presented in Table 1.
Table 1. Model “Underfit”, “Fit”, and “Overfit” ranges
Remembering that:
• “Underfit”: when the model fails to capture trend data;
• “Fit”: when the model captures trend data and it is able to generalize when exposed to untrained data;
• “Overfit”: when the model captures trend data, but it is not able to generalize when exposed to untrained data.
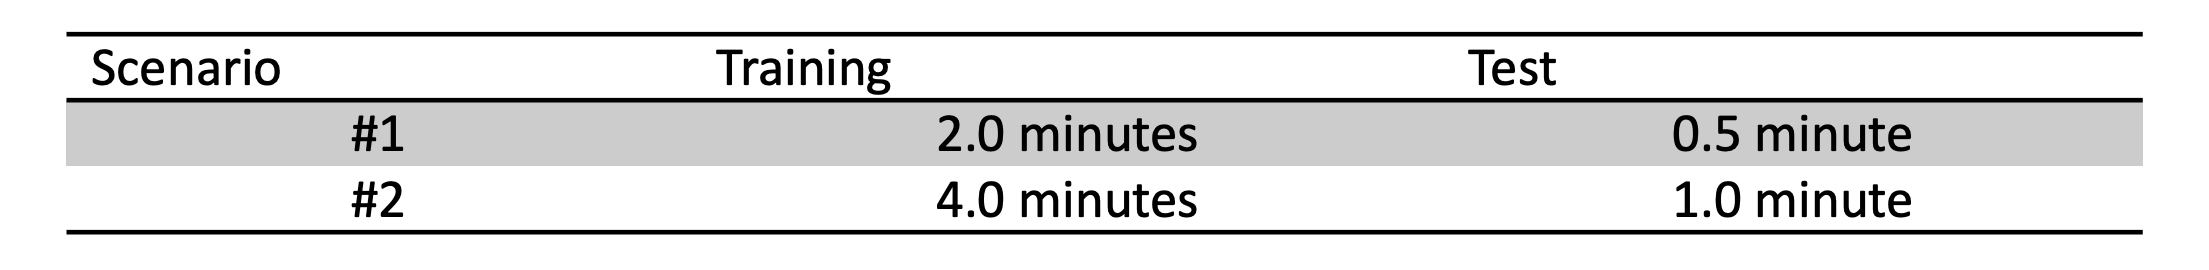
It is important to always follow the 80/20 ratio for Training and Testing for each of the categories (“class33” and “class22”). In this case, the datasets were created every 10 seconds at 91Hz or 11ms until completing the necessary time to reach the “Fit”, as shown in Table 2.
Table 2. Time required for Training and Testing scenarios for each of the categories
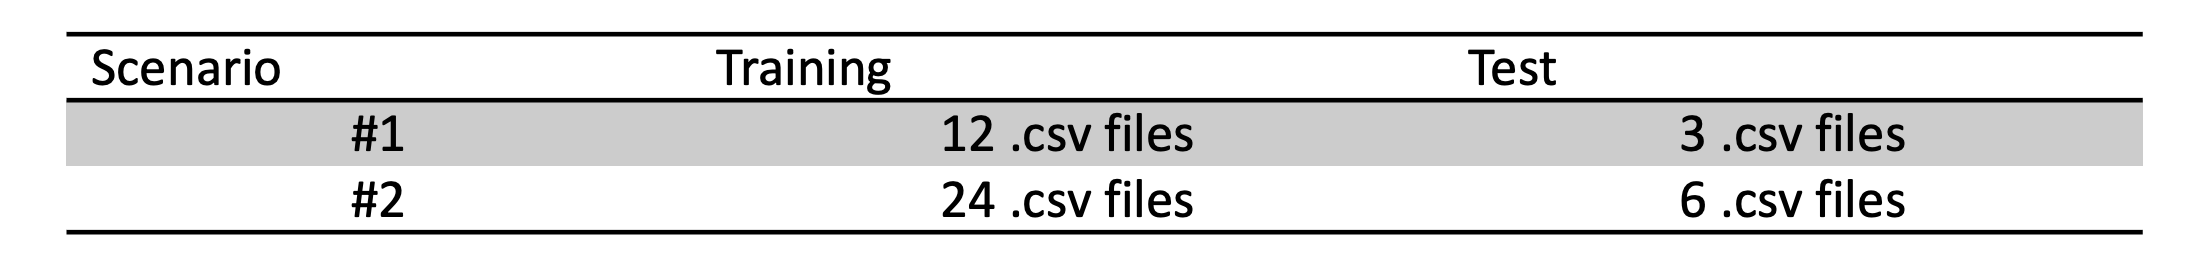
For the completion of the time required for Training and Testing of each scenario and each of the categories (“class33” and “class22”), the datasets were created in .csv files, as shown in Table 3.
Table 3. Datasets in .csv files for the Training and Test scenarios of each of the categories
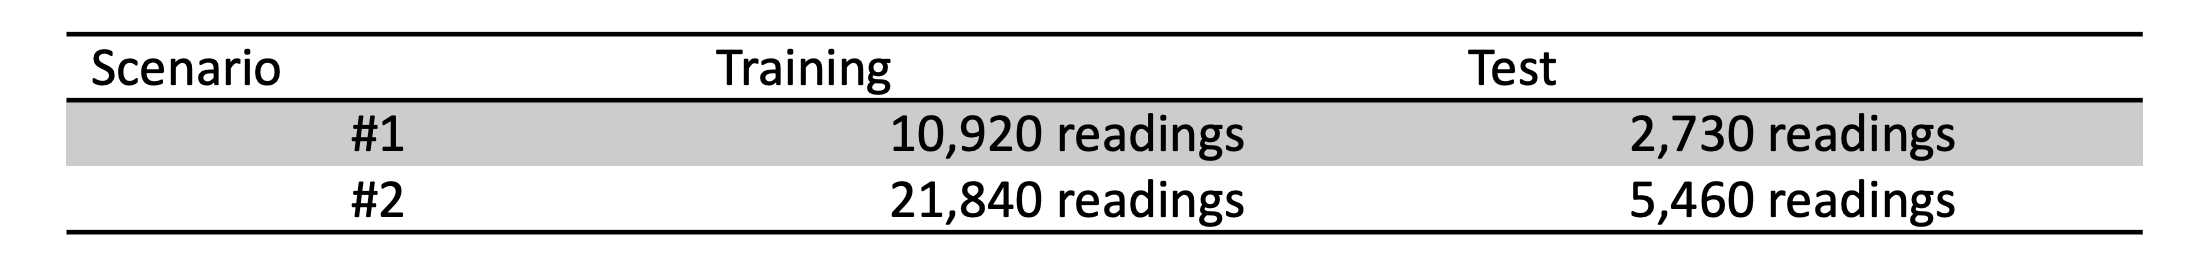
If each 10-second file at 91Hz or 11ms contains 910 readings, the following amounts of readings were required for Training and Testing for each scenario and each of the categories (“class33” and “class22”), as shown in Table 4.
Table 4. Number of readings for the Training and Test scenarios for each of the categories
In the data input, a 1-second sample window was considered for each category. Considering, for example, the “class33” category, the 1-second window data is shown in Table 5.
Table 5. “class33” category data in 1-second sample window
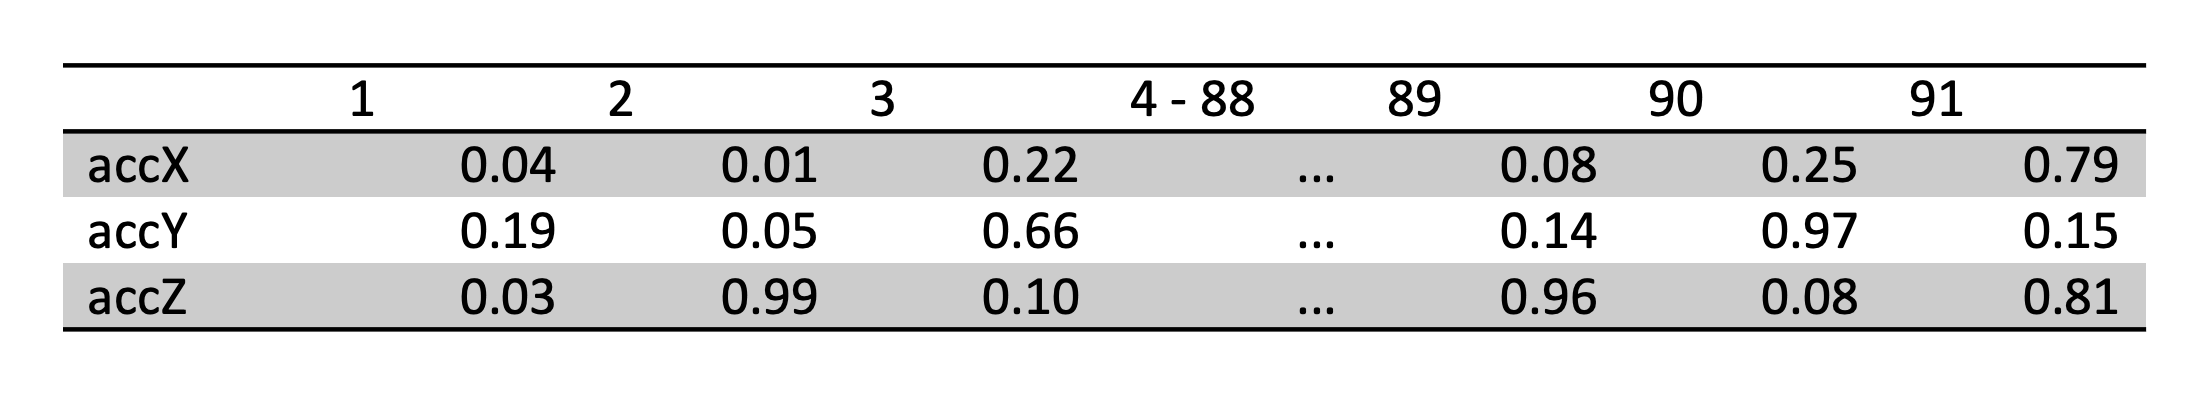
Since there is data on all 3 axes (accX; accY; accZ), the 1-second sampling window displays 273 raw data (91 raw data x 3 axes).
In the data processing, the spectral analysis plays the role of reducing the dimensionality of the data, transforming the data in the time domain (in milliseconds) to the frequency domain (in Hz). A highly complex topic that uses Digital Signal Processing [DSP] and related to process samples of discrete signals.
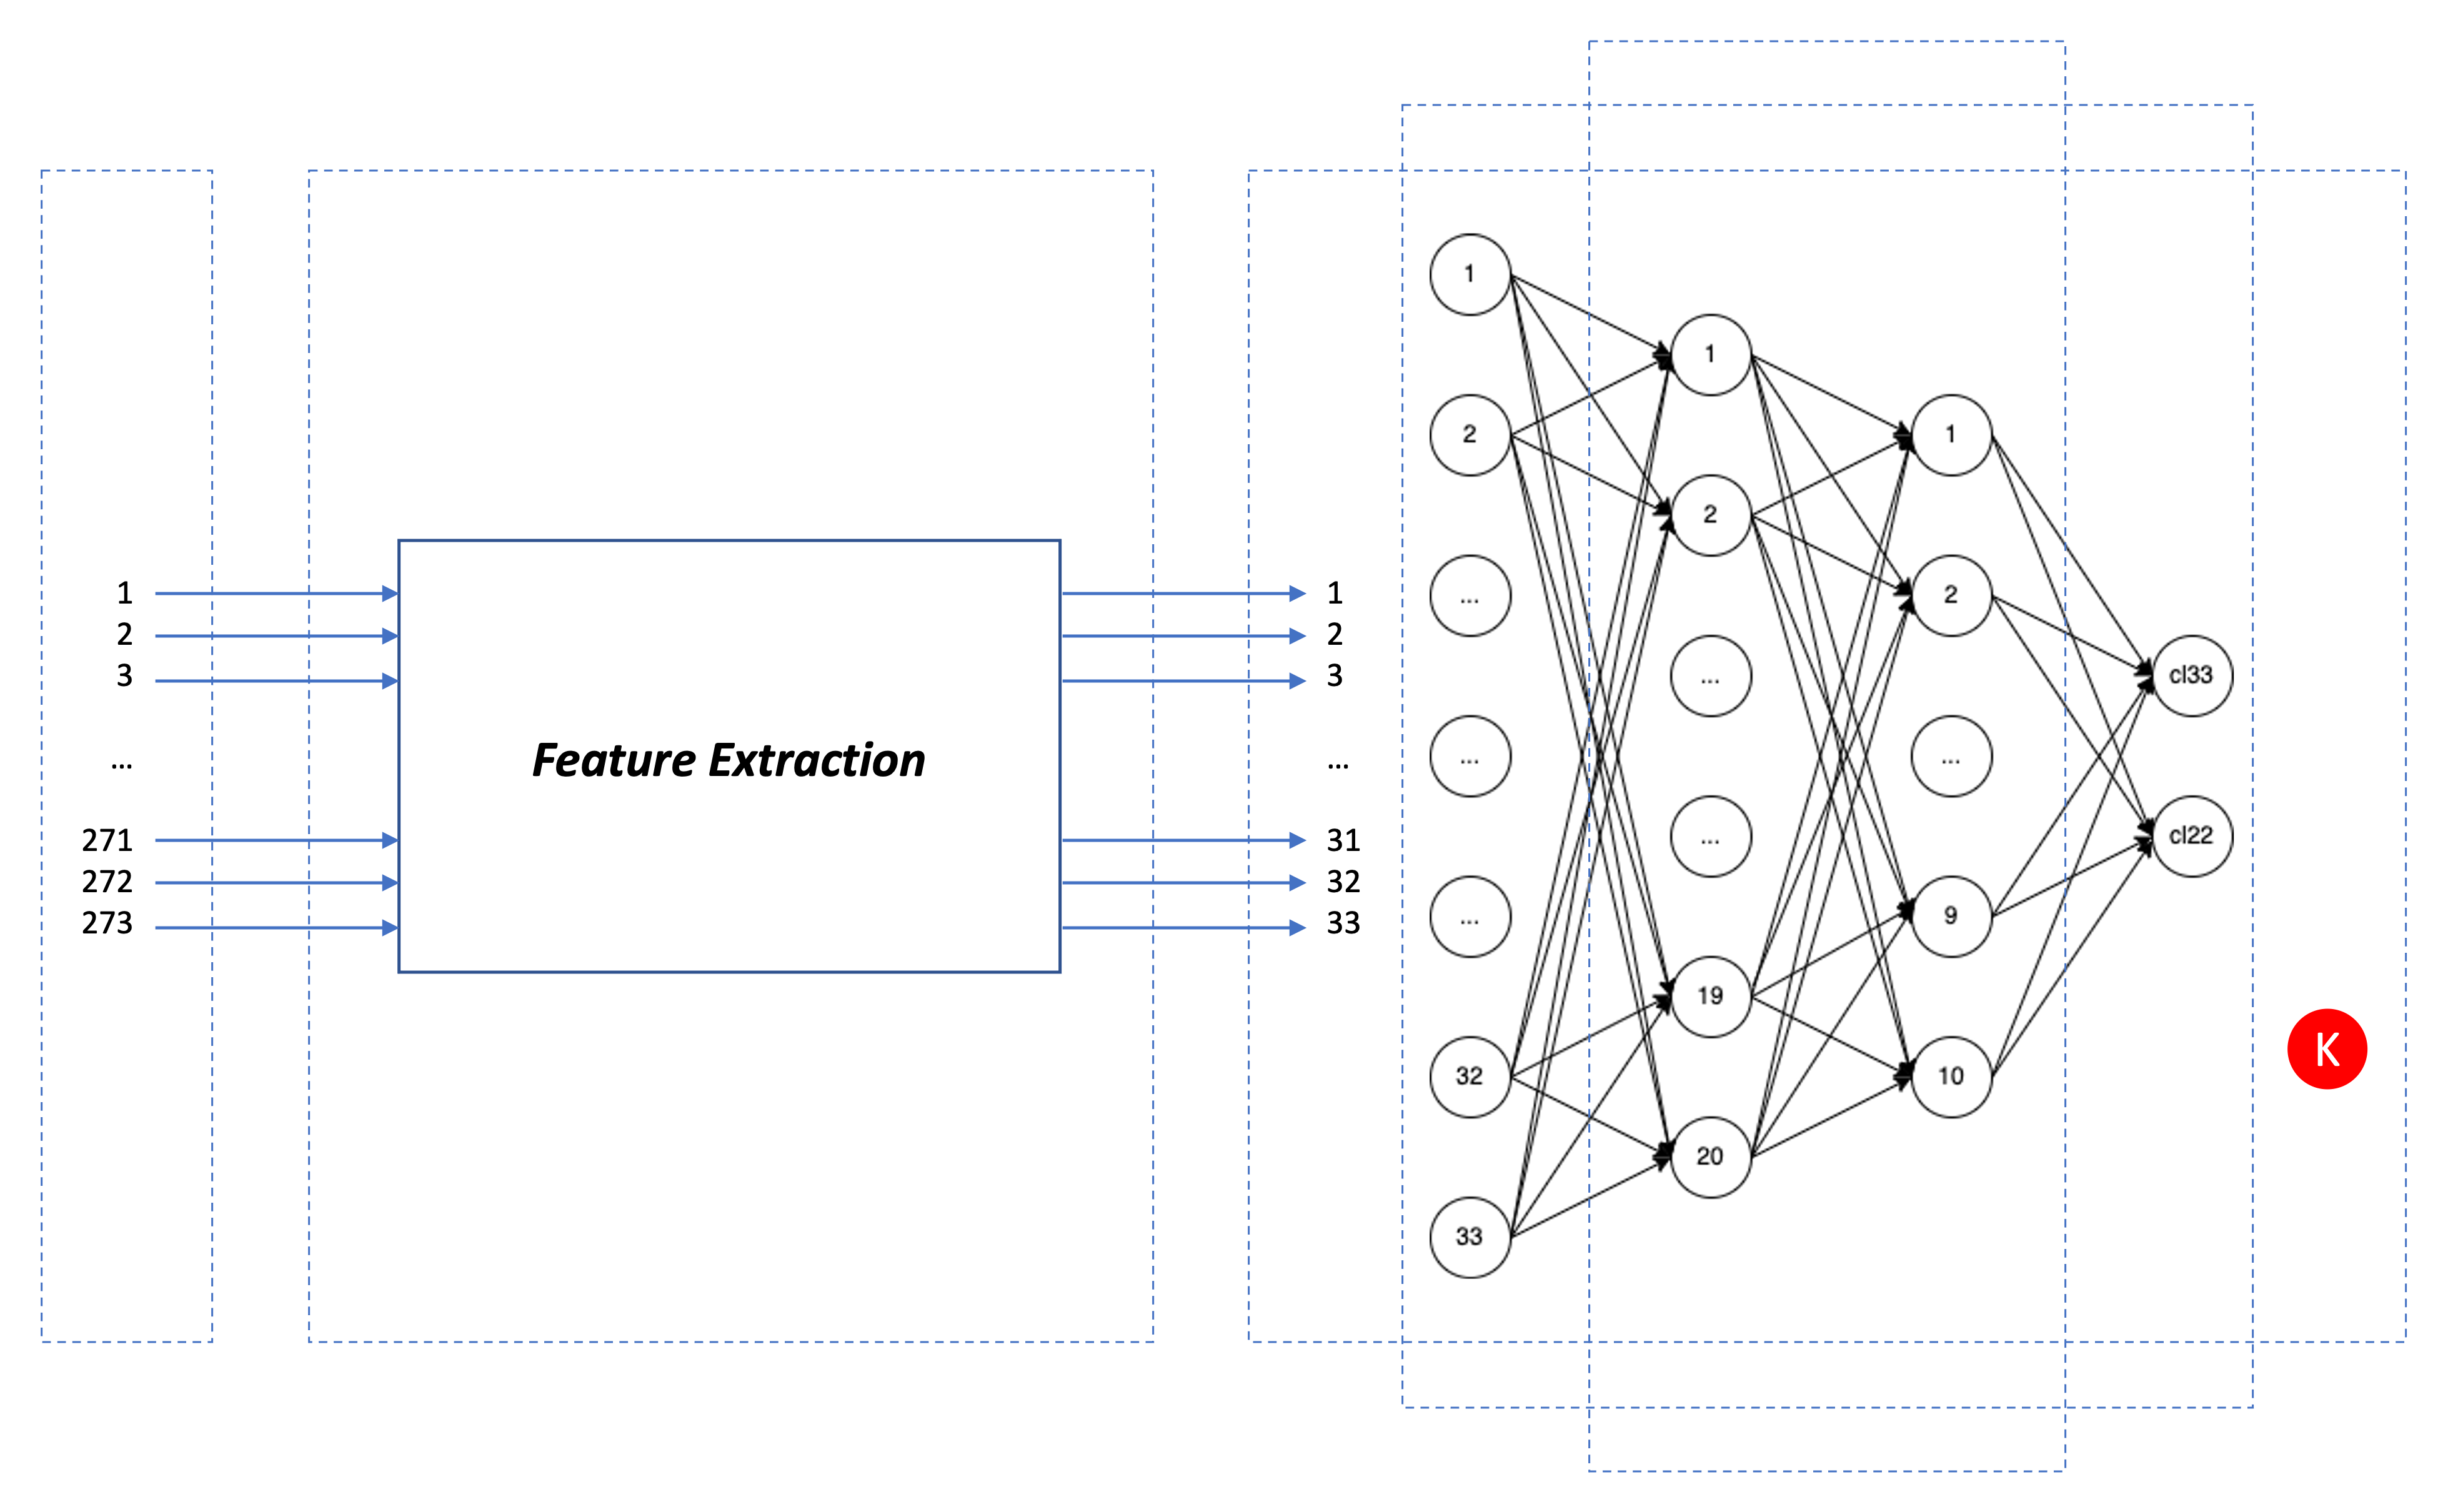
The advantage of Feature Extraction is to transform Raw Data into Feature which is processed with better efficiency, managing to maintain the characteristics of the original data. Remembering that Feature is the characteristic of an observed phenomenon. The result of the Feature Extraction is 33 features (11 features x 3 axes).
According to what was obtained in the Feature Extraction (33 features), some different Artificial Neural Network [ANN] architectures were experimented to build the ANN Classifier. In order to load balance all elements involved (the scope and resources of the project, the expected outcome as a digital product, and the best practices), the final configuration is as shown below:
- 1 input layer with 33 neurons;
- 2 hidden layers:
- First hidden layer with 20 neurons;
- Second hidden layer with 10 neurons.
- 1 output layer with 2 neurons representing the two categories (“class33” and “class22”)
For the configuration of the project, consider the block diagram with all elements linked, according to the image shown in Figure 3:
- Data input: Time Series [TS];
- Data processing: Spectral Analysis – Feature Extraction;
- AI learning: Classification (Supervised Machine Learning) + Artificial Neural Network [ANN] Classifier (Deep Learning) + Anomaly Detection (Clustering / K-means) (Unsupervised Machine Learning).
Source: Wardston Consulting
The outputs
With the data samples in each of the scenarios presented in Table 4, good separations of the categories (“class33” and “class22”) in Clusters were obtained.
Consider the following Generated Features with separation of categories (“class33” and “class22”) in Clusters for each scenario according to the image shown in Figure 4.
Scenario #1 – Generated Features
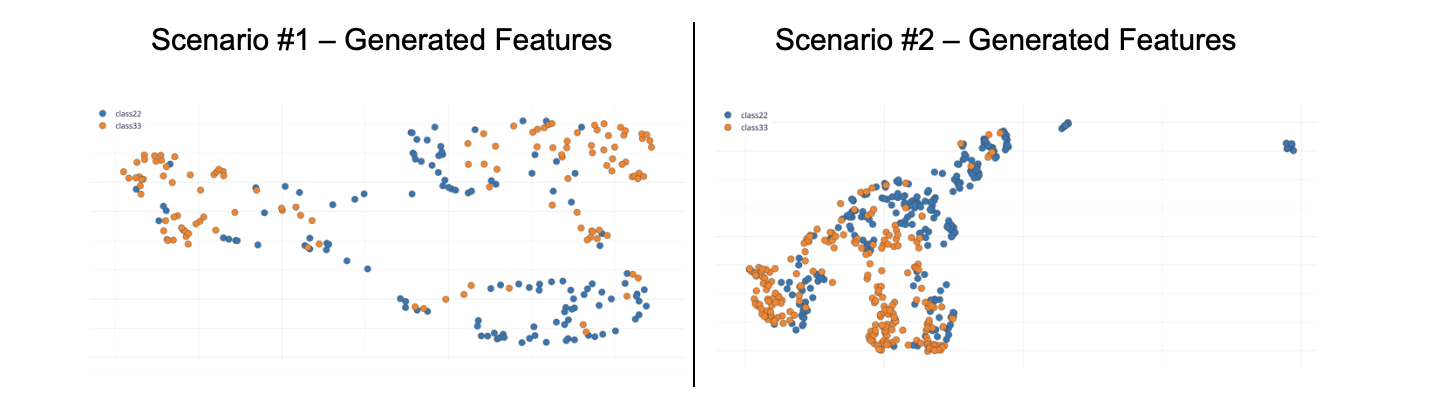
Source: Wardston Consulting
Consider the following Training Data with separation of categories (“class33” and “class22”) in Clusters for each scenario according to the image shown in Figure 5.
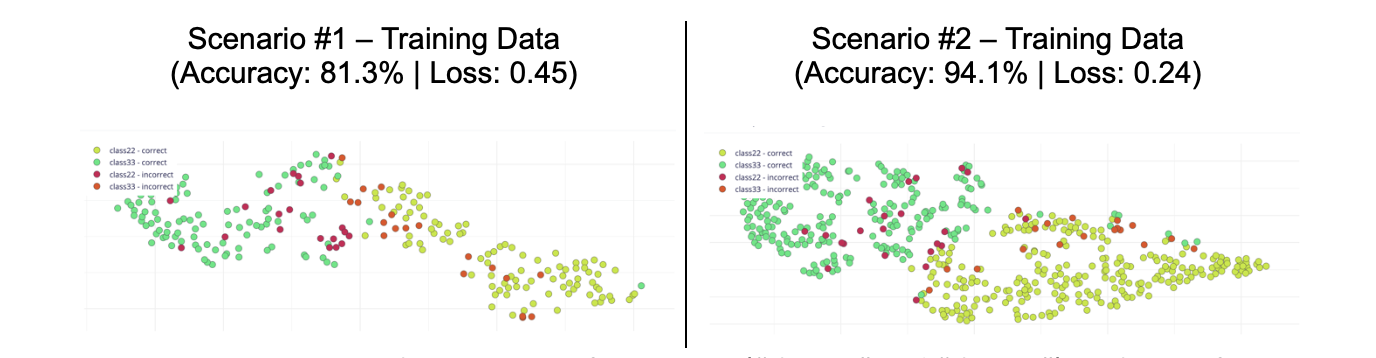
Source: Wardston Consulting
Consider the following Test Data with separation of categories (“class33” and “class22”) in Clusters for each scenario according to the image shown in Figure 6.
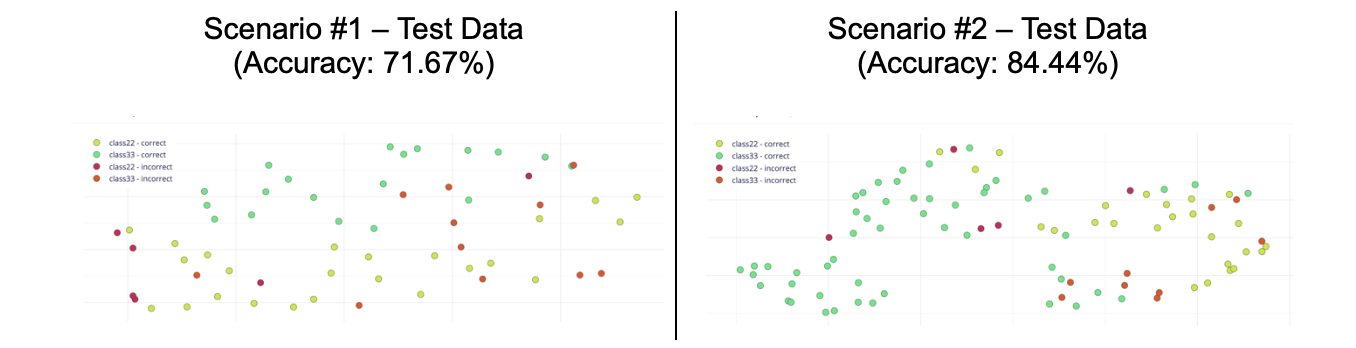
Source: Wardston Consulting
Per the analysis between Scenario #1 versus Scenario #2, it is possible to consider that Scenario #2 has a better fit to the goal of this article.
Conclusion
The “how” to overcome the challenges mentioned in the beginning of this article make the difference to the success of the delivery. And, as it could be noted, the topic is quite complex, which demands a multidisciplinary approach: Data Science and Engineering (Electrical, Electronic, Hardware, Software, Cloud/Fog/Edge, Database, Telecom/Networks, and related) for the correct use of the techniques and tools for management, development, and deployment.
There are other ways to deal with anomaly detection. So why choose this method ? Despite being a refined method, collecting just few tens of minutes of data and the distributed systems touchbase represent savings in financial resources and project time, as well as robustness and reliability of results based on accuracy.
With that said, the application of Data Engineering, the support of a cloud env in the development, training, and testing of Machine Learning [ML], Deep Learning [DL] / Artificial Neural Network [ANN] algorithms to perform data inference in real-time, with the support of Engineering and the Internet of Things [IoT], demonstrate the benefits of the adopted approach and compose a solution that adds value for any industry segment with the necessary adaptations. It is clear that, for each use case, there is a need for contextual analysis and a customized project, not being recommended the total or partial reproduction of the data, algorithms, parameters, and/or any other generated element for the inference of the data mentioned above.
About the author
 Dalton Oliveira, MBA is a Global Digital Transformation Advisor, Board Member, Mentor, Speaker, Writer, Judge in Awards at Wardston Consulting. International awarded Top 3 IoT World Series, Facebook Testathon Best Product Idea, and more. Experienced in managing global mission-critical applications/solutions & PMO (portfolio/program/project/product management) in strategic initiatives by leading Advisory Groups (VP’s, Directors, Managers) of multidisciplinary, multicultural, and remote teams to meet business growth strategy in global companies leading their segments, governments, universities since 2002. BSc in Electronics Engineering (FEI University) and MBA in Data Science & Analytics (USP University).