
In my last IIoT World article ‘Are you ready for the digital twin’, I introduced some of the many business objectives we can optimize using a contextualized, holistic view of our plants. I shared several data sources, both engineering and real-time, that can help us create that 360-degree view of our equipment, systems, processes, and plants.
I also suggested many of these data sources exist, just in different information systems. We will have to find a way to connect to these data sources. Once connected, we will want to turn the data into information that can drive decisions and actions. So, let’s start building.
Data Inventory:
By associating the engineering, control systems, Industrial IoT condition monitoring, and operational activity data with the equipment we essentially are creating a form of digital twin. We define a digital twin broadly as a digital representation of a physical asset that is used to gain insight into its operational state, its performance, and its condition. We incorporate all the data needed to help drive human and computer decisions that work to optimize the plant’s performance.
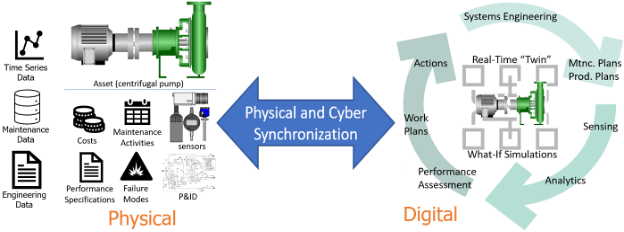
In addition to data mentioned we also want to track plant activity that is related to the asset. This activity includes maintenance activities, the cost of maintenance, and safety and environmental. As a result, we can deliver a holistic picture of the assets health and performance to those who operate and maintain the equipment.
Data Connectivity:
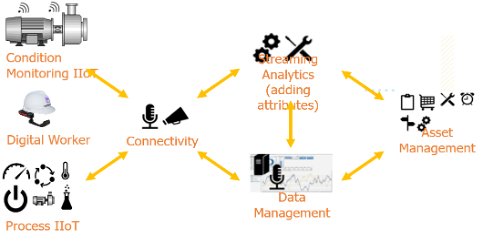
From an Information Technology (IT) perspective, we can think of a data collection and analysis network, or data platform, that connects our field sensory data to streaming analytics and recording, and to the Asset Management application.
Some of the data we collect may be high frequency data or images from cameras. These inspection data sets need preprocessing, breaking down the complex data into condition indicators.
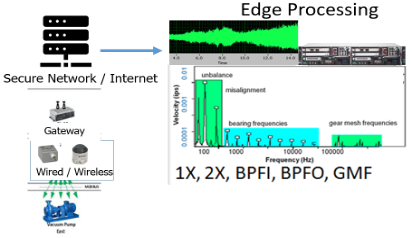
For example, vibration, ultrasonic, and motor current dynamic time waveforms can be processed with Fast Fourier Transforms (FFT), digital filters, and other signal processing techniques that produce one or more condition indicators related to the equipment. Thermal image processing can label temperatures at several points within the image. The results of the streaming analytics are trend-able equipment condition and performance indicators. Streaming analytics are core to managing complex or high frequency data.
Data Visibility:
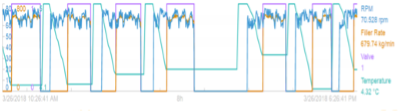
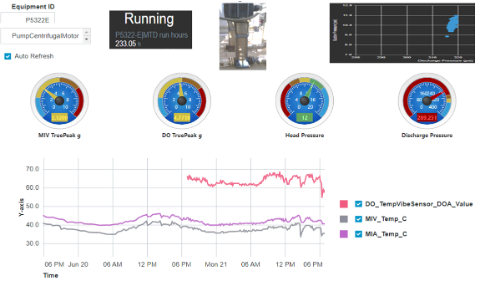
Now that we have real-time data, both from the process and from our condition monitoring sensors, we make it visible. For example, the flow rate parameter pulled from the control system, coupled with the rotational speed of the pump as pulled from the motor drive, together are good indicators of whether the pump’s operating state is ON or OFF. Later, we can use this to calculate run-time and schedule any preventative or usage-based maintenance accordingly.
Our next step is to add in the condition indicators from our condition monitoring system. Now we can see the response of these indicators to different operating conditions. We will need these “data groupings” for our advanced analytics down the road.
Even with trending data, and threshold values from our engineering references, we can build some descriptive dashboards. These dashboards often represent individual equipment, or systems, or even the plant. Providing an equipment hierarchy style menu allows for navigation through-out the plant, complete with roll-up threshold violations.
The benefit to the responsible user is data from multiple sources is presented in a high-level dashboard. For example, control systems data including pressure, is displayed along with IoT vibration and temperature data.
Our responsible users, our subject matter experts (SMEs), have a more holistic view of their equipment and processes. Better decisions are made with better and more complete data. Ideas for analytics and process automation begin to become clearer.
Build Your Team:
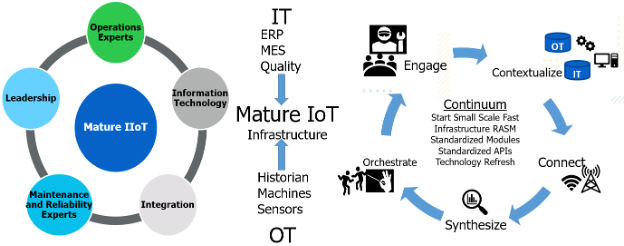
Putting all the pieces together takes a team. Modeling (thresholds, data relationships) takes engineering and SMEs, as well as information technologies to manage the underlying “digital twin” system. Monitoring requires a field network with security, connectivity, and bandwidth to support the controls network, the Industrial IoT condition monitoring network, and the connected worker network. Analytics takes additional experts to turn the analytical results into actionable information (business process automation). Work requests and improvement requests are then delivered to the planners, along with the expected benefit. Going further, the digital field worker can access dashboards, digital enabled workflows, and training.
To pull this story together, it takes a team to implement Industrial IoT and the associated Digital Twin in manufacturing. We need to work with operations, maintenance and reliability, leadership, information technology and integrate all the sensor and applications. A Mature IIoT environment is really a convergence of Engineering Technology (ET), Information Technology (IT) and Operational Technology (OT). There are many components in the process. In addition to coordinating all the team members, we are challenged with long term management, refresh, and evolution of the infrastructure.
There is a lot to do, it takes a village. Yet, each plant and enterprise should be taking its first steps today. Fortunately, there are many integration teams, reliability consulting teams, process experts, and information technology teams available to assist in the journey.
More about Plant Asset Management Strategy
This article was written by Preston Johnson is a Senior Solutions Manager with CB Technologies, Inc. (CBT). CBT is a domain expert systems integrator with deep knowledge in IT and OT systems and integration. As a solutions manager, Preston focuses on Monitoring and Analytics as he assists clients begin their digital journey. Preston is also the Chairman of the Society for Machinery Failure Prevention Technology (MFPT). Preston is MFPT chair of the Data Management and AI focus group, and a fellow of MFPT.