Every machine vibrates differently, and sensor placement on a machine can make or break the data quality. This IIoT World article is based on a video interview recorded at Hannover Messe 2026 with Julien Romala (Application Engineer, Tronics Microsystems, a TDK Group company). Where a vibration sensor sits, how quickly it learns what normal looks like for a specific machine, and whether the diagnostic computation happens on the device or somewhere else all shape what a monitoring program actually delivers. In an interview at Hannover Messe 2026, Julien Romala, Application Engineer at Tronics Microsystems (a TDK Group Company), walked through how the company’s VIBO vibration sensor handles each of these factors, from computing FFT at up to 50 kHz directly inside the sensor to connecting multiple sensors on a single bus cable.
1. What Does the VIBO Sensor Produce When FFT Runs at 50 kHz Inside the Device?
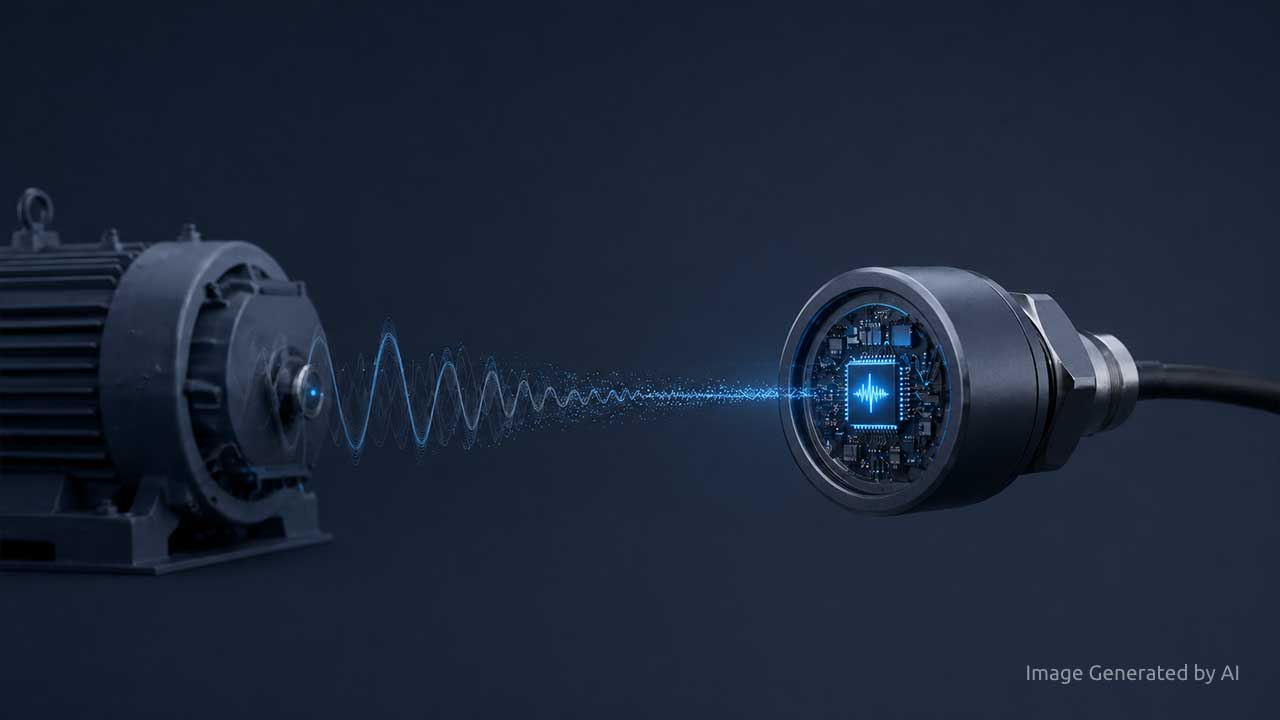
Computing FFT at up to 50 kHz directly inside the sensor produces the time signal, the frequency-domain representation, and computed indicators such as RMS acceleration, all on the device itself.
The VIBO sensor delivers three types of output. The first is computed indicators, values like RMS acceleration that the sensor calculates internally. These indicators can be used to follow trends over time, and when a value begins to deviate from a stable baseline, the deviation signals that deeper investigation is needed.
The second is the FFT itself, the frequency-domain representation of the vibration data. During the booth demonstration at Hannover Messe, the sensor moved from the time signal directly into what was described as “the frequency world,” displaying the frequency components of the vibration.
The third is the raw time-domain signal, available when a deviation calls for deeper analysis. The sensor makes all three types of data accessible, with indicators driving routine trend monitoring and raw data available when the situation requires it.
Multiple sensors connect on a single bus cable. In the booth demonstration, three sensors were connected on one bus, with one cable serving all of them. This bus architecture replaces individual wiring for each sensor in the monitoring setup.
2. Why Does Sensor Placement Determine Measurement Quality?
Mounting the vibration sensor as close as possible to the bearings, gearbox, and critical rotating components ensures good measurement performance.
Sensor placement can make or break data quality. The sensor needs to be as close as possible to the parts being monitored, typically the gearbox, the bearings, and the critical rotating components. Being close to these components is what ensures good performance during the measurement.
3. How Fast Does Baseline Learning Produce Useful Results?
Learning time ranges from a few hours to a few days depending on process stability, with stable equipment producing usable measurements faster than machines running variable processes.
Once the sensor is placed correctly, it begins learning what normal looks like for that specific machine. Some equipment is stable for a month and won’t change at all. For those machines, the measurement can be completed in a few hours. Other equipment runs very different processes that change fast, and those require a different kind of monitoring altogether.
4. How Does Automotive-Grade Testing Apply to Industrial Vibration Sensors?
The automotive industry is demanding in terms of testing, with extensive standards that apply to sensors, and Tronics applies the same rules to its VIBO vibration sensor for industrial applications.
Julien Romala spent nearly a decade testing hardware in automotive and industrial environments before joining Tronics. That background shapes how VIBO is validated: extensive testing in different kinds of conditions, including temperature, to make sure that the sensor will last.
VIBO Sensor Capabilities
| Feature | Detail |
| Signal processing | FFT at up to 50 kHz computed directly inside the sensor |
| Output types | Time signal, FFT (frequency domain), and computed indicators |
| Trend monitoring | RMS acceleration and other indicators tracked for deviations |
| Deeper analysis | Raw time-domain signal available when deviations are detected |
| Connectivity | Single bus cable for multiple sensors |
| Testing | Automotive-grade standards applied, including temperature and other conditions |
This article is based on a video interview with Julien Romala, Application Engineer at Tronics Microsystems (TDK Group), and Lucian Fogoros of IIoT World, recorded at Hannover Messe 2026. AI tools were used to help summarize and organize the content. Reviewed and edited by the IIoT World editorial team.
Sponsored by Tronics Microsystems.
Related coverage:
Frequently Asked Questions
1. What does the VIBO vibration sensor produce?
The VIBO sensor from Tronics Microsystems produces three types of output: computed indicators such as RMS acceleration for trend monitoring, FFT data showing the frequency-domain representation of the vibration signal, and the raw time-domain signal for deeper analysis when deviations are detected.
2. How do you determine where to mount a vibration sensor on a machine?
The sensor should be mounted as close as possible to the component being monitored, typically the bearings, gearbox, or critical rotating parts. Proximity to these components ensures good measurement performance.
4. What is edge processing in a vibration sensor?
Edge processing in a vibration sensor means the sensor computes diagnostics internally on the device. The VIBO sensor from Tronics Microsystems computes FFT at up to 50 kHz directly inside the sensor, producing computed indicators, frequency-domain data, and raw time signals as three types of output.
5. How long does vibration sensor baseline learning take?
Baseline learning ranges from a few hours to a few days depending on process stability. Equipment that is stable and won’t change for a month can produce a usable measurement within hours. Equipment with processes that change fast requires a different kind of monitoring and a longer measurement window.
6. How is AI being used in manufacturing operations?
The VIBO sensor from Tronics Microsystems computes FFT at up to 50 kHz and produces diagnostic indicators directly inside the sensor, making time signals, frequency-domain data, and raw vibration data available on the device. Indicators such as RMS acceleration can be used to follow trends over time, with raw data available for deeper analysis when deviations are detected.
7. What are the top predictive maintenance strategies for manufacturing?
Vibration monitoring strategies covered in this interview include mounting sensors as close as possible to bearings, gearboxes, and critical rotating components for good measurement performance, using computed indicators such as RMS acceleration to track trends over time, moving to FFT and raw data analysis when deviations are detected, and selecting sensors tested to automotive-grade standards for industrial durability.